Advisor Insights
Envision success with assets and revenue data visualizations
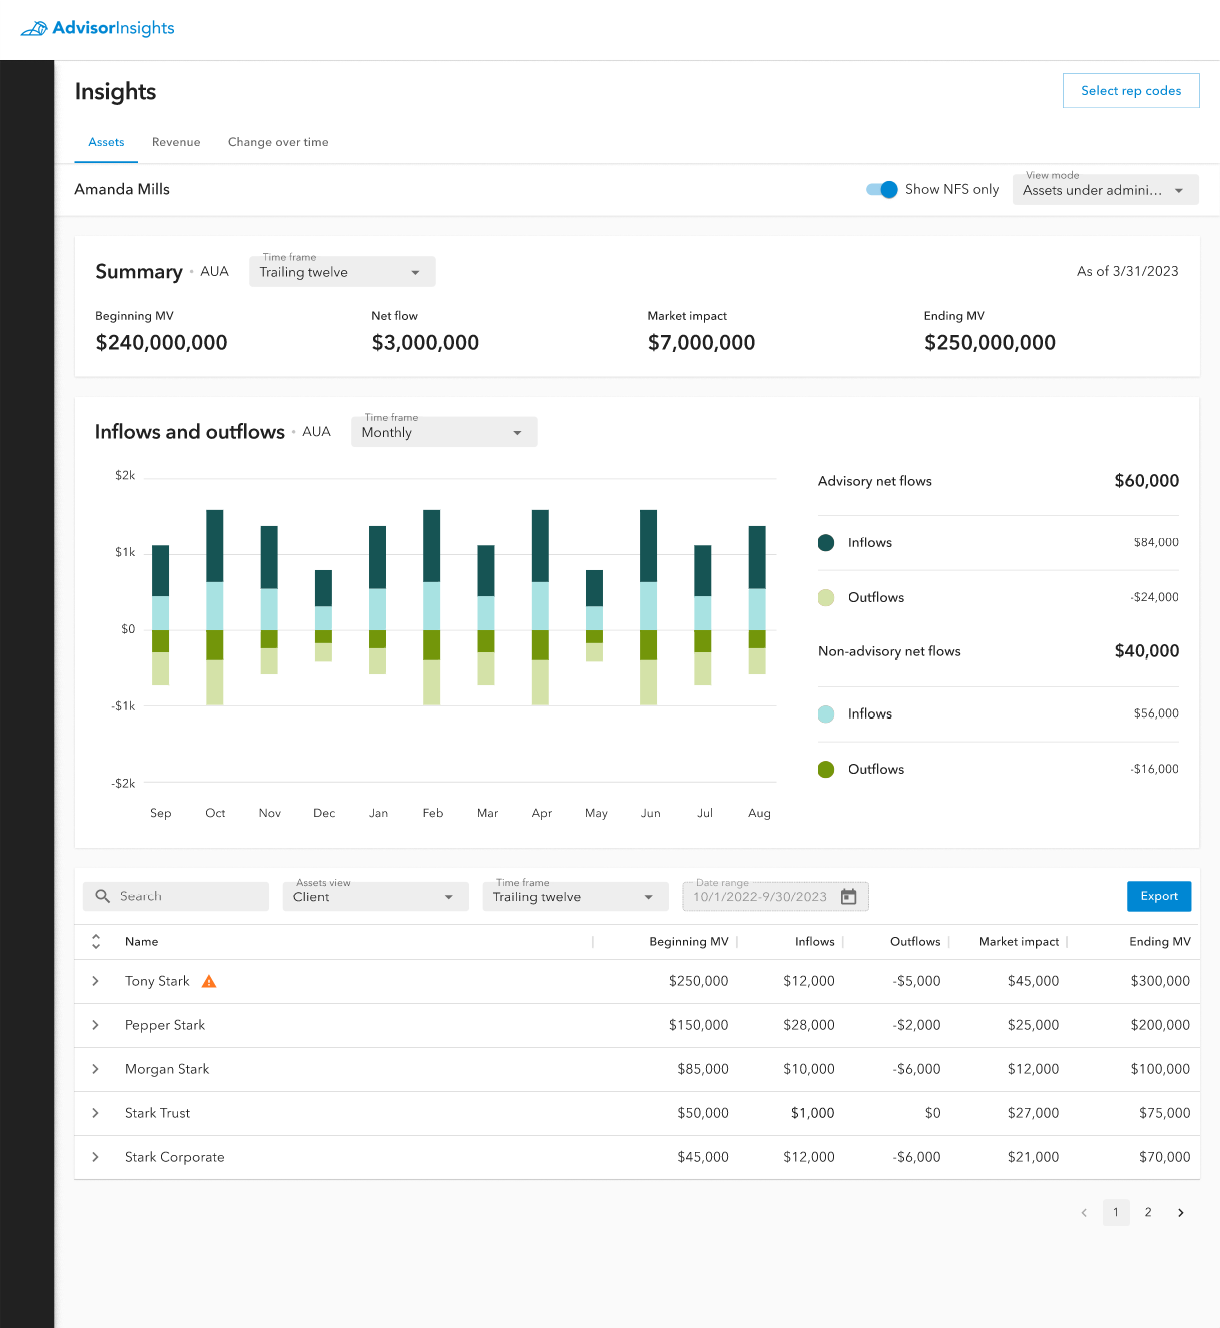
This is the assets tab on the Advisor Insights page. It displays assets data for the logged in user for a specified timeframe.
In an effort to continue empowering financial success for its financial professionals and their clients, the data governance team at Kestra Financial wanted to provide a better dashboard for viewing accurate and up to date asset and revenue data.
To facilitate this project the UX team, under my leadership, was asked to design a data visualization dashboard that would make this data both aesthetic, and easily digestible for our users.
We continued with the Quill Design System which was created for the Digital Account Opening project, and had since become the primary design system for AdvisorComplete.
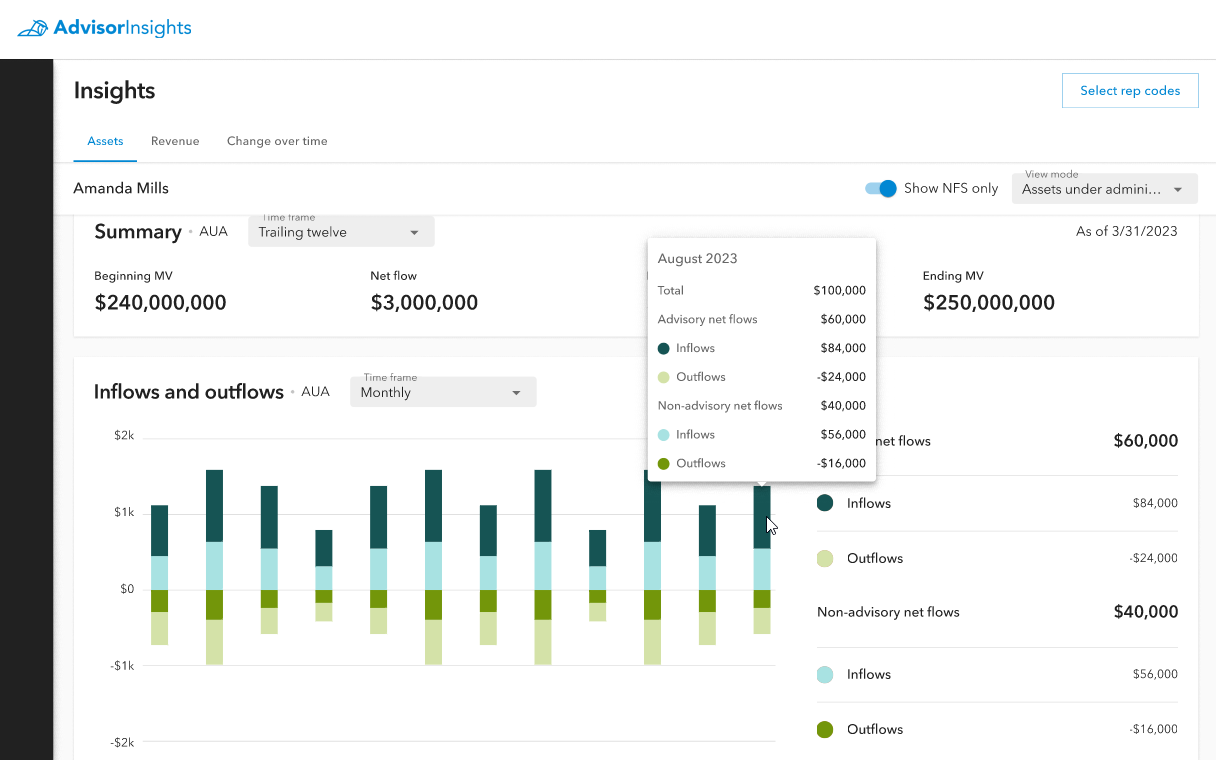
A close of the Advisor Insights assets tab showing the data breakdown in the bar chart which is available on hover, an example of some of the interactivity available to users.
By keeping with the clean experience we created for DAO, we could ensure both visual consistency for our users, and allow the data to shine.
We utilized the graph and chart colors from the Quill color palette to ensure that our visualizations were easily understandable while also meeting the aesthetic preferences of our users.
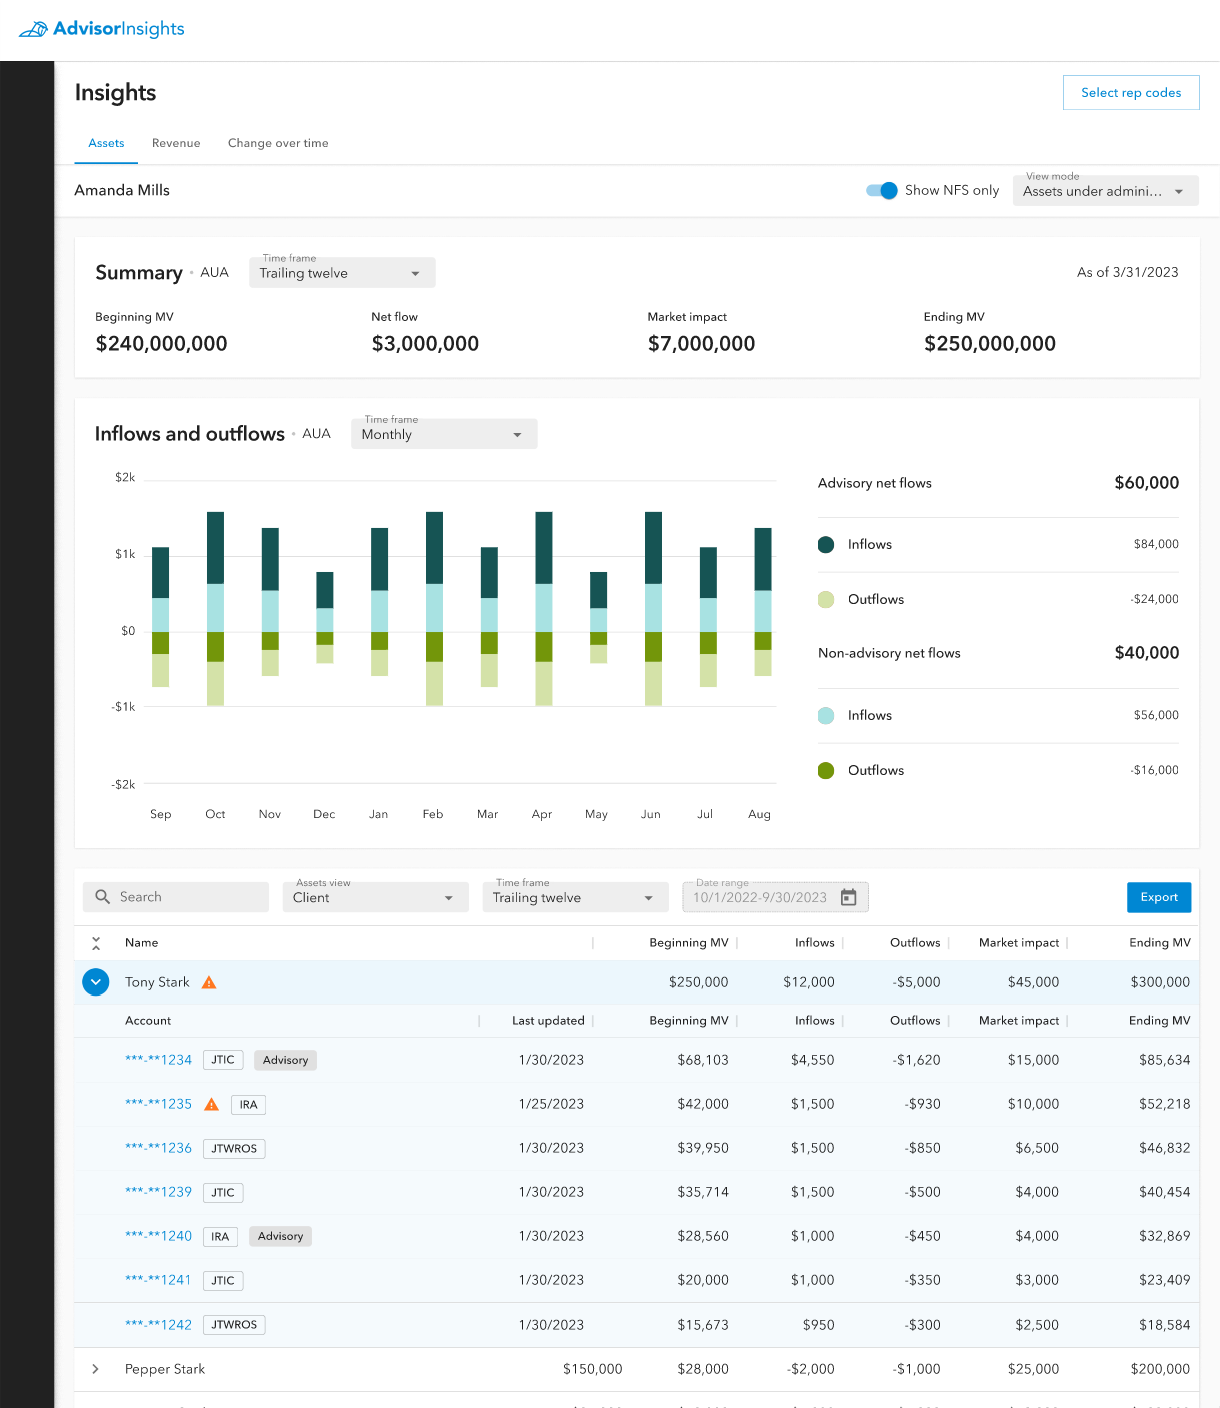
The assets tab on the Advisor Insights page with an example of a client row in the bottom table expanded to view account line data.
Each page was structured to hold three sections.
The first section was a general summary of the data that page focused on (assets or revenue). This summary consisted of the most important data points our users would always want to see front and center. These data points are displayed in bold and large font to be immediately eye-catching so that our users wouldn't have to hunt for them.
The middle section would hold the primary data visualization for the page. This would be a chart type that best fit the data being displayed. For asset data, this was a bar graph which displayed the inflows and outflows of client assets. This particular example is showing Assets Under Administration, so the data is further broken down by advisory and non-advisory assets.
The last section of the page held the line-item data of the page.By default this table was organized by client, which could be expanded to view the line-item account data for that client. The table could also be switched to view the data by rep code.
In order to ensure users could be confident in the freshness of the data being displayed, we also added a pattern to display a warning icon on line-items which might have trailing data.
We also provided an export button so that users could download a csv of the data to transform to their own needs.
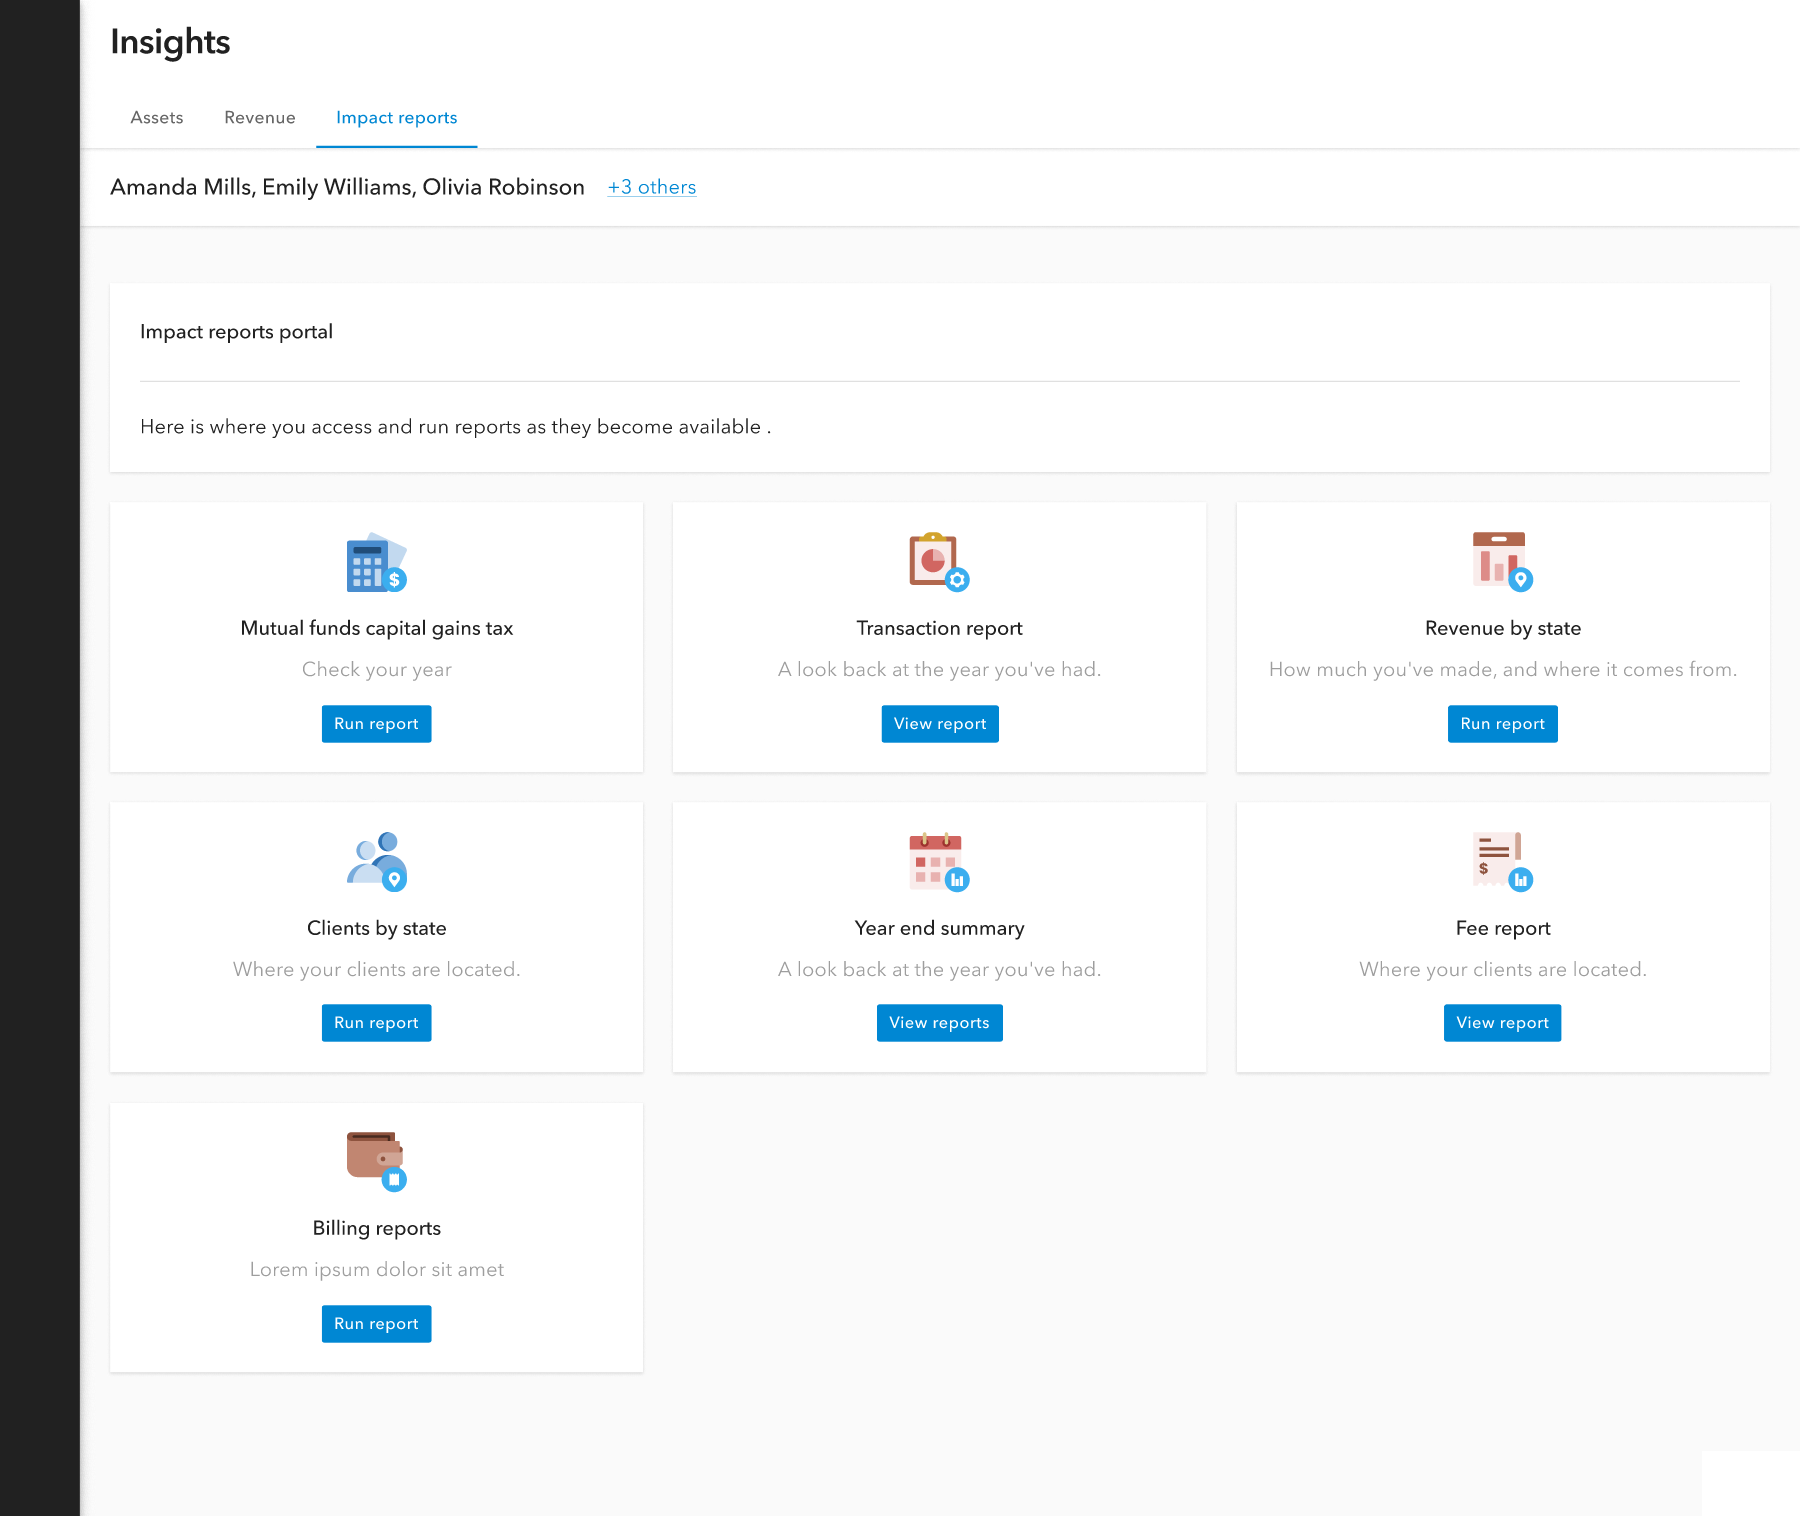
An example of a self-serve custom report dashboard where you users can generate their own reports as needed.
In addition to the assets and revenue dashboards, we also recently released a new tab called Impact Reports.
This new feature allows for users to generate additional reports as they need to throughout the year. This self-service report tool gives our users independence to pull data reports whenever they need while greatly reducing the amount of custom report requests being sent to our home office.
Future enhancements
Not all of the ideas we proposed for the first few releases of Advisor Insights were able to be implemented. Here are some of those examples.
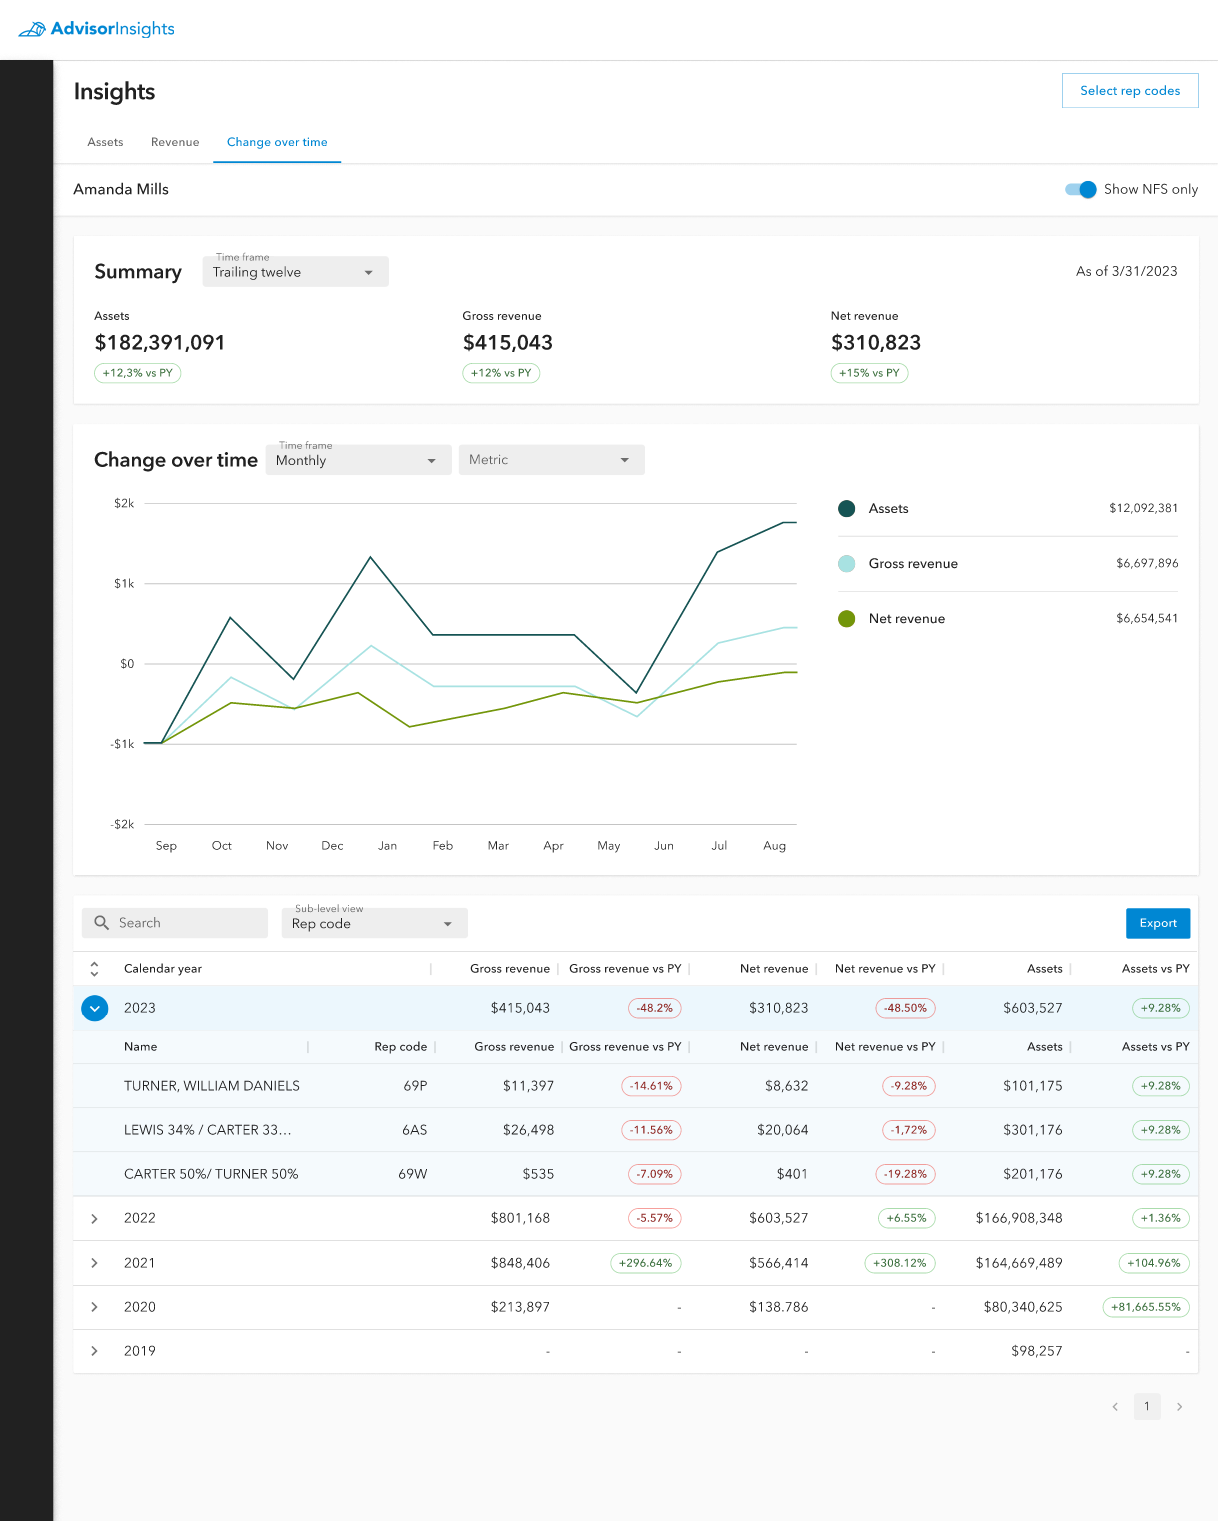
Designs for the change over time tab.
This was intended to be a third primary tab for Advisor Insights which focused on a Change Over Time comparison between assets, gross revenue, and net revenue.
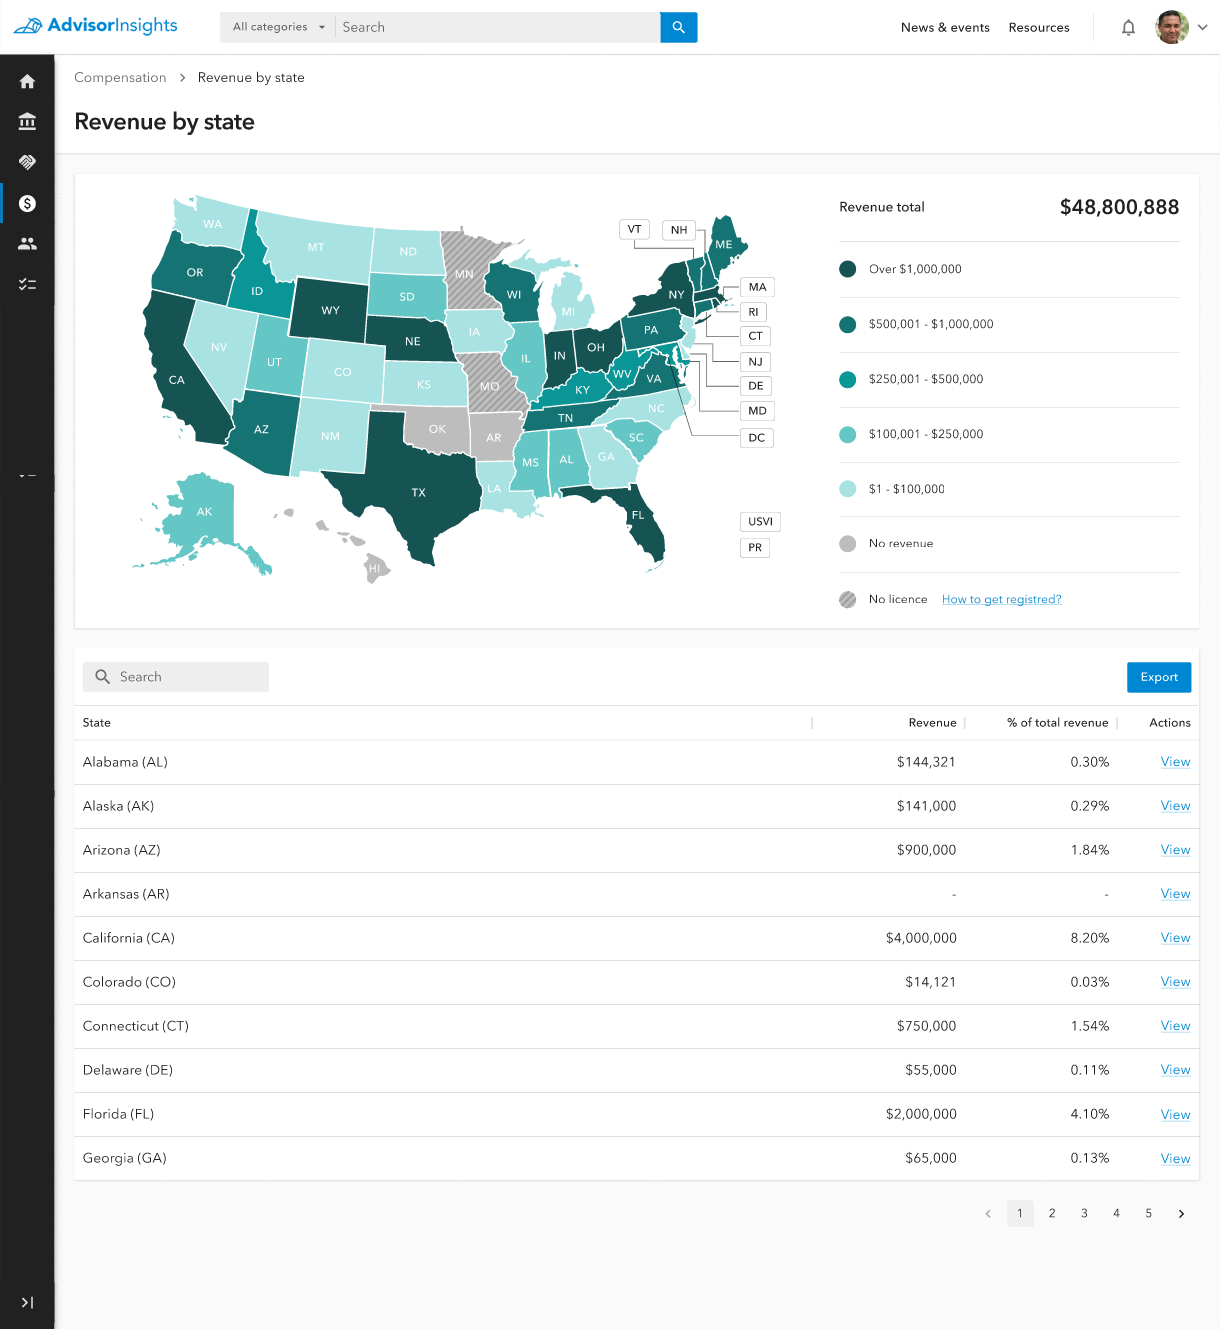
This is a potential design for a page which would allow financial professionals to view their revenue by state.
This is an example of some of the ideas our team proposed that would allow users to see different types of data segmentation. In this case, users would have the ability to view their revenue gains visualized by the state where the revenue was gained. This could give financial firms the ability to see areas of the country where they have better financial success than others, and where they may be missing out on revenue due to not holding appropriate licenses to do business in certain states.